

Higher Education Retail Market Facts & Figures
There is also a significant difference in the percentages of four-year schools [67%] compared to two-year [33%] colleges and technical schools. The following graphs show the disproportionate distribution of institutions and student enrollment across higher education.
When discussing the college market, the number of students enrolled is one of the most common measures used in comparing college campuses. It is important to consider both total enrollment and the FTE [full-time equivalent] numbers for institutions, as well as the percentage of full-time and part-time students, in order to make relevant comparisons. For many institutions, there are significant differences in total enrollment and the full-time equivalent (FTE) number of students. And while the FTE number of students allows for an "apples-to-apples” comparison between campuses in some cases, knowing the corresponding total enrollment for an FTE number can be valuable in other measurements of comparison.
WHY IT MATTERS
An institution and its campus store serving 4,000 FTE students and total enrollment of 4,200 students will differ significantly from a campus with 4,000 FTE students and 12,000 total enrollment.
COLLEGE STORES
While college students are often referred to by age and student status as a single market, the college market is actually quite diverse and encompasses a wide mix of consumers that wield substantial buying power across the country.
The following graphs demonstrate some of the diverse characteristics that represent the current composition of today’s college student. From full-time and part-time enrollment by institution type and student age, to institution type and student race/ethnicity.
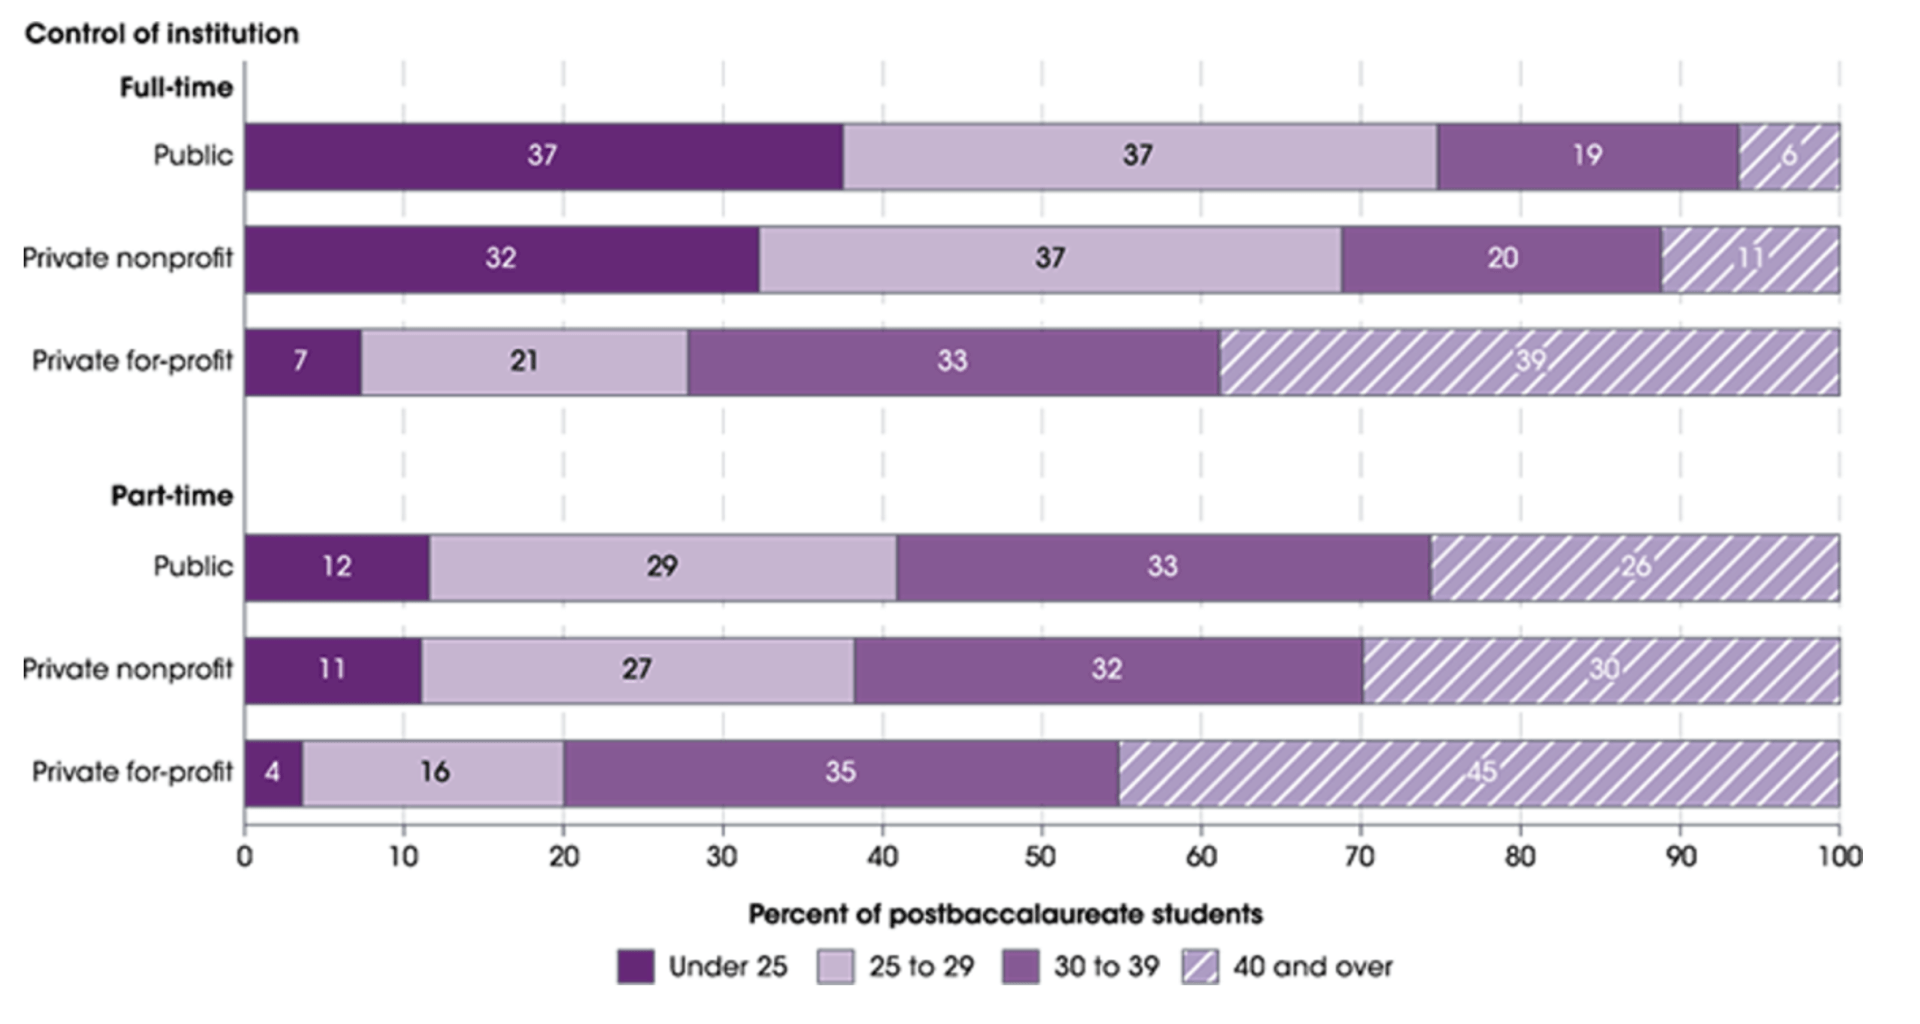
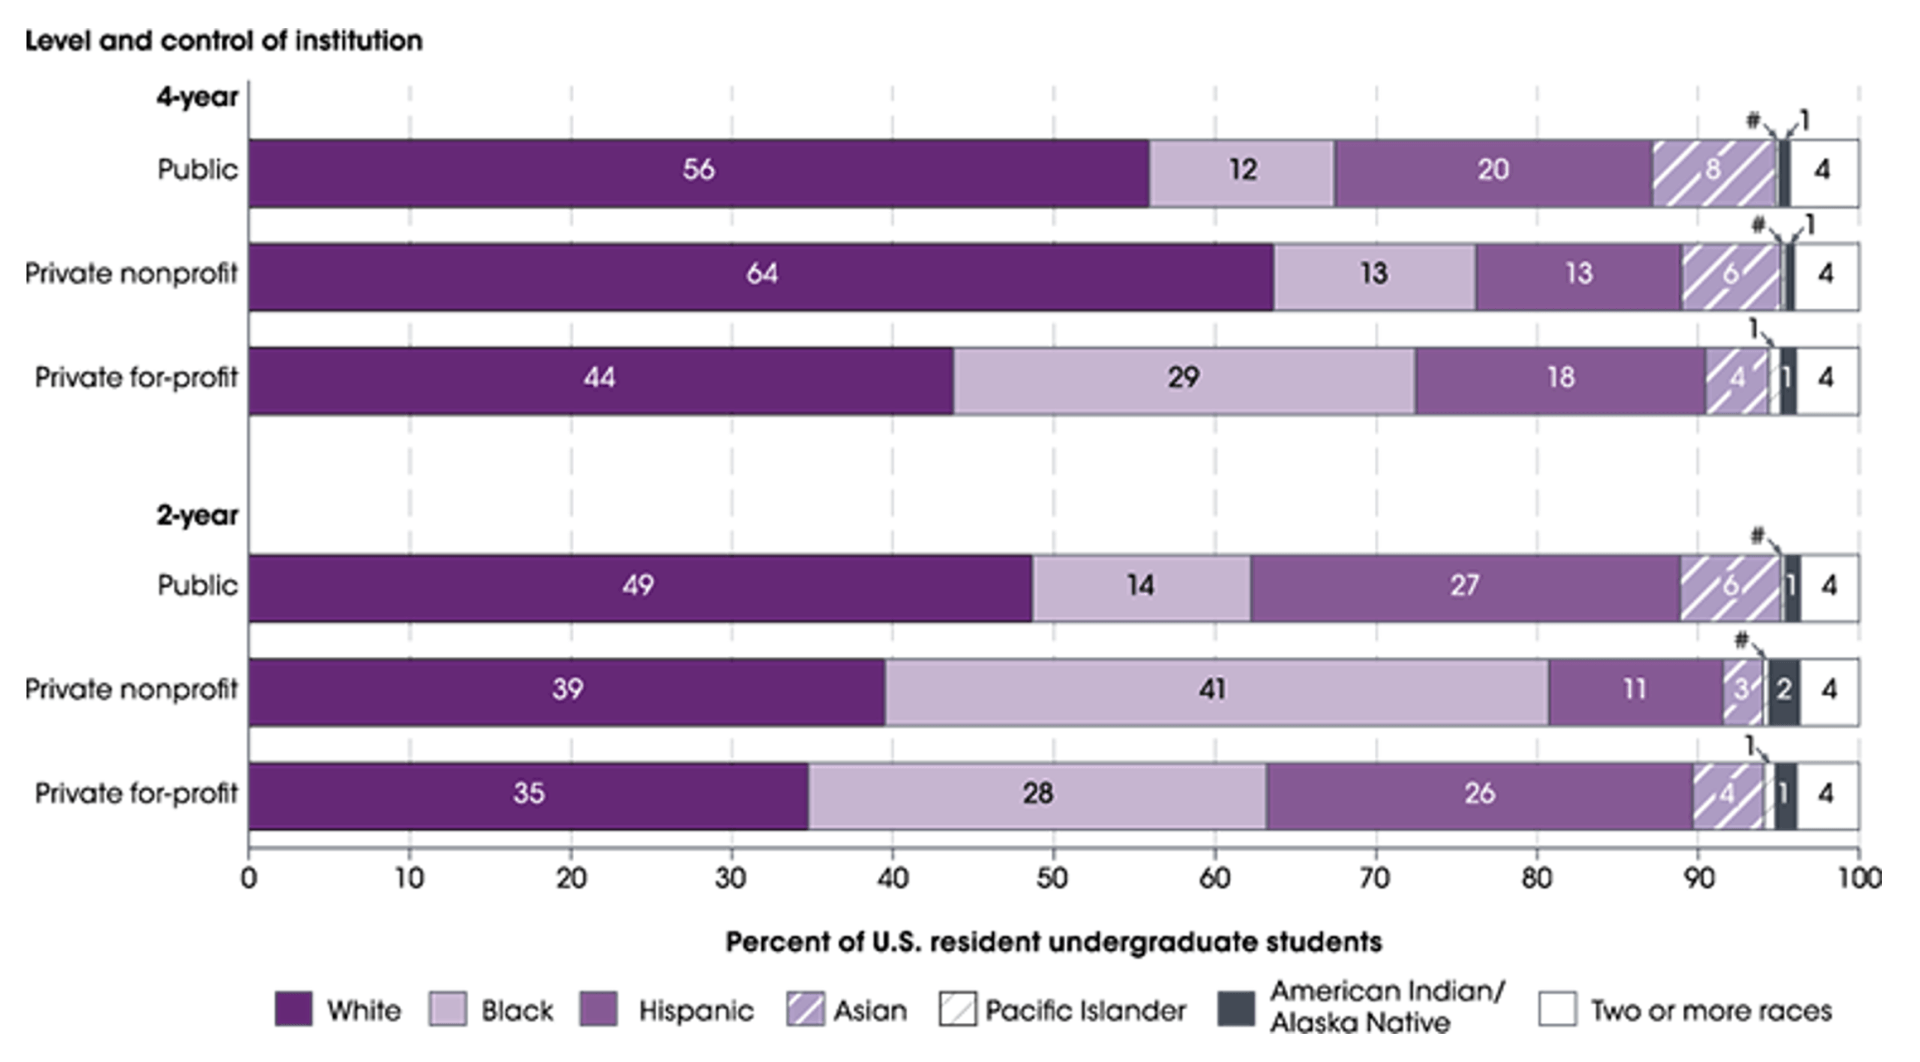
SOURCE: U.S. Department of Education, National Center for Education Statistics, Integrated Postsecondary Education Data System (IPEDS), Spring 2018, Fall Enrollment component.
COLLEGE STORES
While there is no official count of campus stores in the U.S., NACS estimates nearly 4,000 stores serve the collegiate retail market. There are varying relationship between an institution and its campus store. Larger universities most often have several stores serving students; smaller institutions may be served by a single store; and several schools in an urban community may share multiple retail outlets. Campus stores often share a common mission, but can vary greatly in size, location, ownership, and customer base.
Many on-campus stores are institutionally owned and operated, but they may also be operated under lease contract, as cooperatives, or by student associations. Off-campus stores are typically private businesses.
The sales volume of a campus stores is determined by many factors, but the major influence on sales seems most closely tied to the size of the institution it serves. Based on the estimated total campus store market and estimated number of stores, average annual sales for U.S. college stores (2018-19) were $2.4 million.
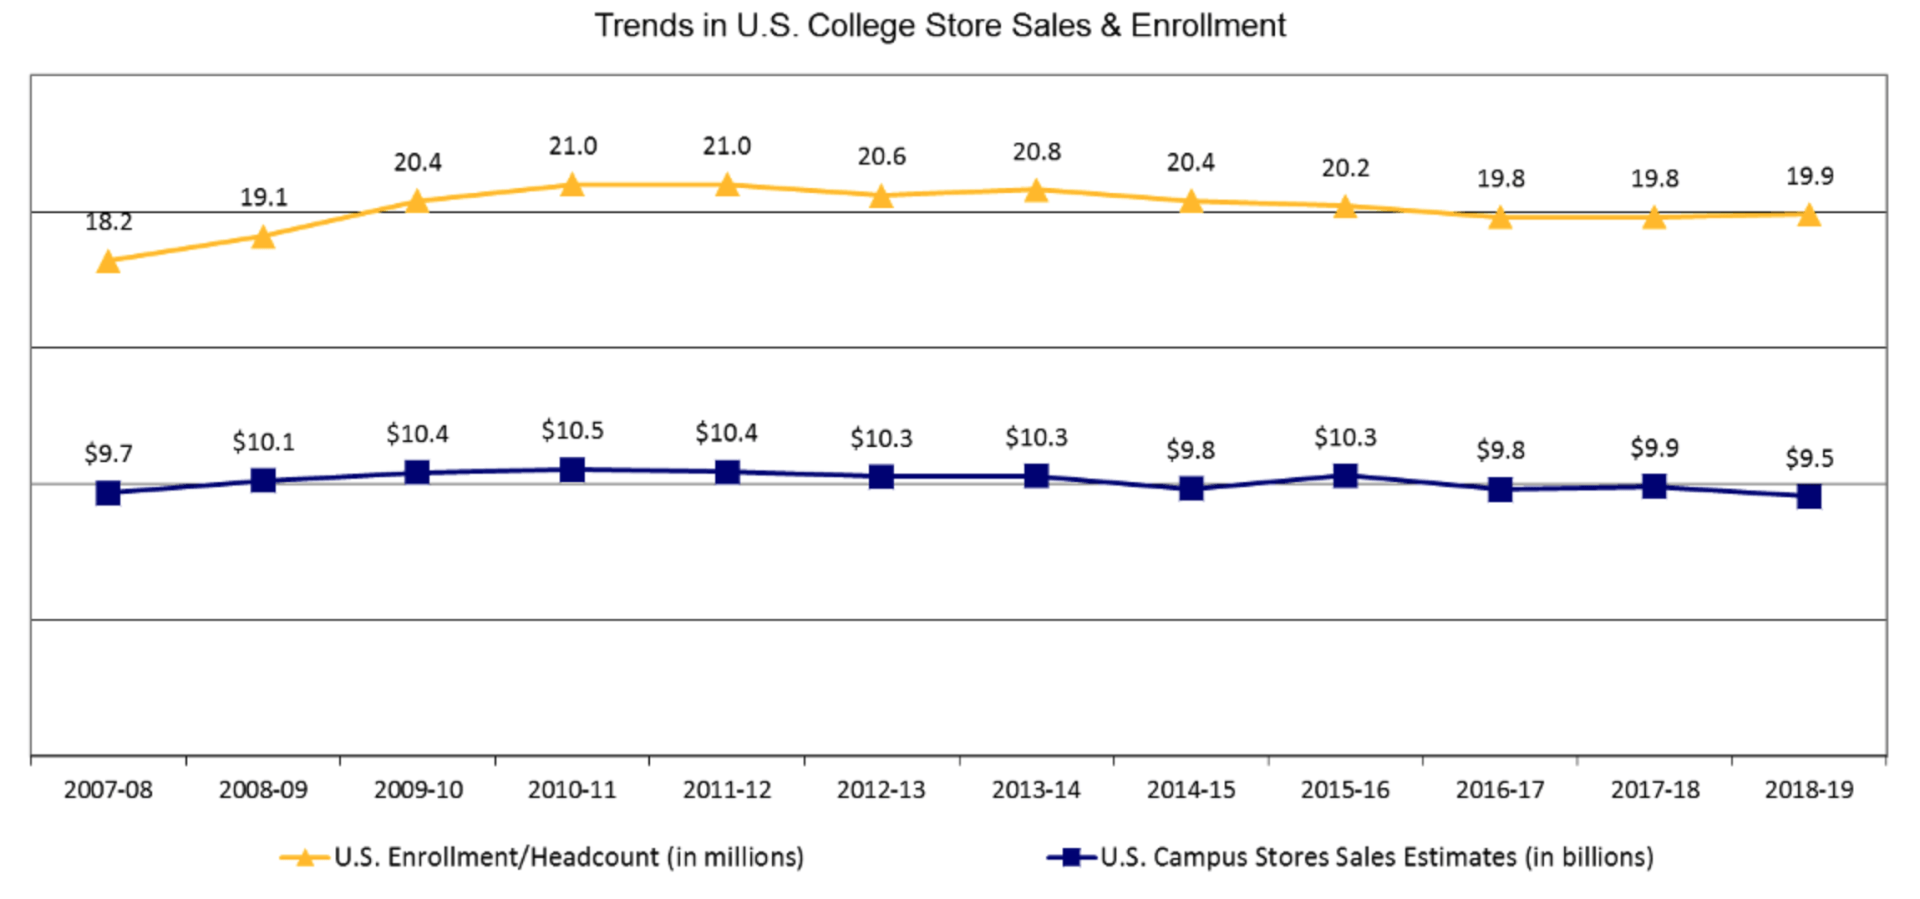
TOTAL COLLEGE STORE MARKET
NACS' estimates of annual sales for all U.S. college stores are shown in the following graph, with corresponding fall enrollments. These figures were estimated based on data obtained in annual financial surveys of college stores. The latest estimate reflects data obtained in the Independent College Stores Financial Survey 2018-19, and enrollment figures from the National Center for Education Statistics.
STUDENT SPENDING
Student spending varies by two-year and four-year schools, part-time and full-time students, student status (1st year–graduate school), and by academic major.
The latest available data on student spending is from Student Watch: Attitudes & Behaviors toward Course Materials, 2020 Final Report. Based on survey data, students spent an average of $413 on required course materials for the academic year. This is down from the $667 students spent a decade ago. Eighty percent of students purchased at least one required course material and 44% rented at least one required course material during the spring 2020 term.
FACULTY SELECTION
According to the 2018-2019 Faculty Watch survey, faculty assign an average of 5 required materials across all of their courses, which breaks down to 1.4 required materials per course. Eighty percent of faculty used some type of non-paid-for material, and the majority (64%) said these non-paid-materials are used alongside paid materials.
3.6
Average number of classes taught
5.0
Average materials
assigned
1.4
Required materials
assigned per course
Many faculty (82%) select the course materials for their courses, while 19% use materials selected for them. Half of faculty (49%) prefer some type of print textbook, while another 16% prefer digital materials, and 22% say it depends on the course. As for actual usage of different formats, 86% of faculty used print between 2018-2019, while 53% used an e-book.
Any questions on college store data or student spending shown here should be directed to OnCampus Research at research@nacs.org.
This information is copyrighted by the National Association of College Stores.
Use of this information is permitted with the stipulation that each and any copy gives full credit to the National Association of College Stores. In addition, copies are not sold, alone or in part with other work(s). Acknowledgment must include the specified NACS publication and citation information.
This permission does not apply to any part of the selection which is independently copyrighted or bears a separate source notation.
Sample acknowledgment and credit line:
©2020, National Association of College Stores, Inc., All rights reserved. No portion of this material may be reproduced without the express permission of the National Association of College Stores.